 |
 |
 |
 |
 |
 |
 |
 |
 |
 |
 |
 |
 |
 |
 |
 |
 |
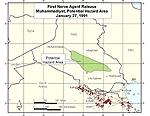
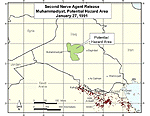
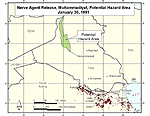
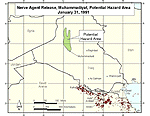
TAB H - Muhammadiyat Nerve Agent Modeling Results
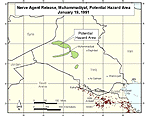
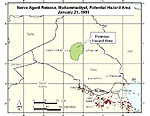
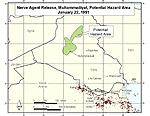
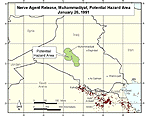
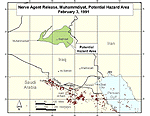
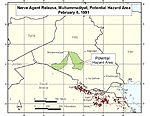
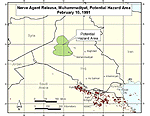
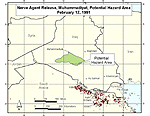
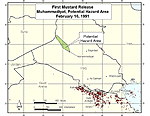
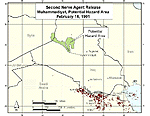
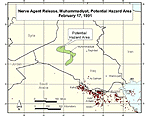
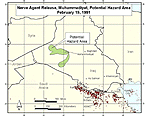
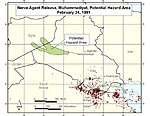
This tab contains the Muhammadiyat nerve agent release modeling results—one hazard area graphic for each potential nerve agent release date. Each graphic carries the date and time of the air strike that possibly released the nerve agent. Note, we postulated that all nerve agent was released at one time and modeled each air strike as if it was the only strike that caused the release. This resulted in the 17 potential hazard areas shown in this Tab.
The hazard area is shaded (green in color versions). The hazard area border is the general population limit (GPL) contour, which shows the greatest extent of the GPL dosage our modeling predicts. Below this exposure level, one would expect no adverse health effects. Thus, anyone situated outside the hazard area is not at risk from the nerve agent release.
In the graphic, dark dots (brown in color versions) indicate US forces. For the 17 air strikes that could have possibly released nerve agent, our modeling indicates no US forces in Saudi Arabia were in the potential hazard area. Modeling suggests the February 6, 1991, air strike produced the hazard area that came closest to US forces. However, the hazard area’s edge was still 35 miles from the nearest company-size unit in western Saudi Arabia. The January 27, 1991, air strike produced the hazard area coming closest (within 80 miles) to the main concentration of US forces at Rafha.
In modeling we assumed bombing destroyed or damaged all the nerve-agent-filled DB-2 bombs on the same day and the nerve agent released instantaneously. These assumptions err on the side of the largest potential hazard area. If in fact the bombs were damaged or destroyed over several days rather than on one day or the release was not instantaneous but occurred over time, the hazard area for each day would be smaller.
Additionally, each graphic shows a "freeze frame" of the largest hazard area. The hazard area grows until it reaches its maximum size shown in the following graphics, which modeling suggests is about 10-12 hours after the release. Then the agent dissipates and the hazard area contracts and eventually disappears.
As described in Tab F, we used three state-of-the-art regional weather models to generate the potential hazard areas shown in this tab. Each weather model has its own unique set of assumptions. Specifically, they differ in the parameterization they use to approximate various physical processes (e.g., clouds and solar energy) in the atmosphere, how they specify surface characteristics (e.g., roughness, vegetation and lake temperature), and the inputs from global weather models they use to start their calculations. Because of their differing assumptions, the three regional weather models sometimes produce different weather predictions (not unlike local weathermen differing on their predictions of tomorrow’s weather). Normally, weather observations from upper air and surface meteorological stations in the region of interest can improve the accuracy of each model’s predictions. However, these data were not available for Iraq during the Gulf War; consequently, each model’s prediction is equally likely. Therefore, to account for the difference in each model's assumptions discussed above, we combined the hazard predictions from each of the regional weather models into a composite potential hazard area. Since these three regional models represent the most advanced weather models, and their respective developers ran them for us to assure proper performance, the composite hazard area provides us with a higher confidence that we have identified all the units possibly exposed to a chemical warfare agent release.
|
|
|
|
|
|
|
|
|
|
|
|
|
|
|
|
|
|